
CALIÉS
CALepinage Intelligent pour l’Énergie Solaire: smart layout for solar energy
From the outline drawn on the map to the feasibility report: CALIÉS lays out a photovoltaic installation on a roof, a car park or a plot of land, in 2D and 3D, and works out its production, economics and carbon footprint.
Eight steps, from the address to the report
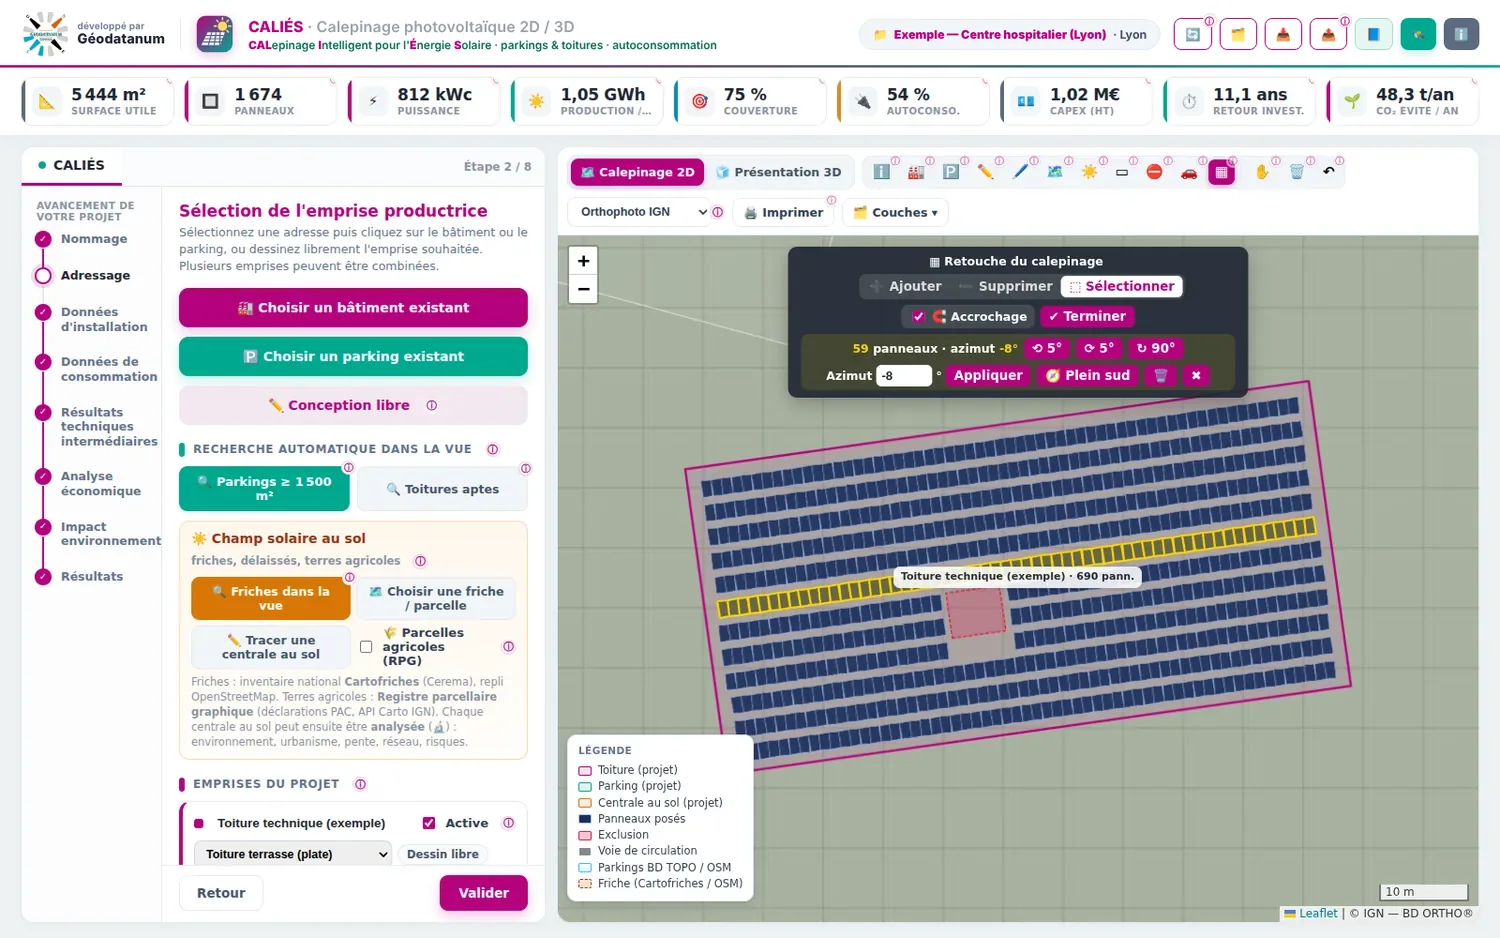
A banner tracks the project at all times: usable area, number of panels, capacity, annual production, coverage, self-consumption, investment, payback period, CO₂ avoided.
-
Naming
Project name, address and site sector.
-
Site selection
Choice of footprints: a building, a car park, a plot of land, or a freehand drawing.
-
Installation data
Solar irradiation, panel model, tilt, orientation, setbacks and shading.
-
Consumption data
Manual entry, load-curve import or estimate, then the sizing target.
-
Technical results
Self-production, self-consumption, coverage rate, monthly balance.
-
Economic analysis
Investment, operating costs, value of surplus power, subsidies.
-
Environmental impact
Carbon footprint of the project: emissions, avoided emissions, payback time.
-
Results
Annotated, laid-out report, PDF printing and exports.
The application in pictures
Nine CALIÉS screens, taken from the sample project supplied with the application. Click an image to enlarge it.
What CALIÉS does
Roofs, car parks, land
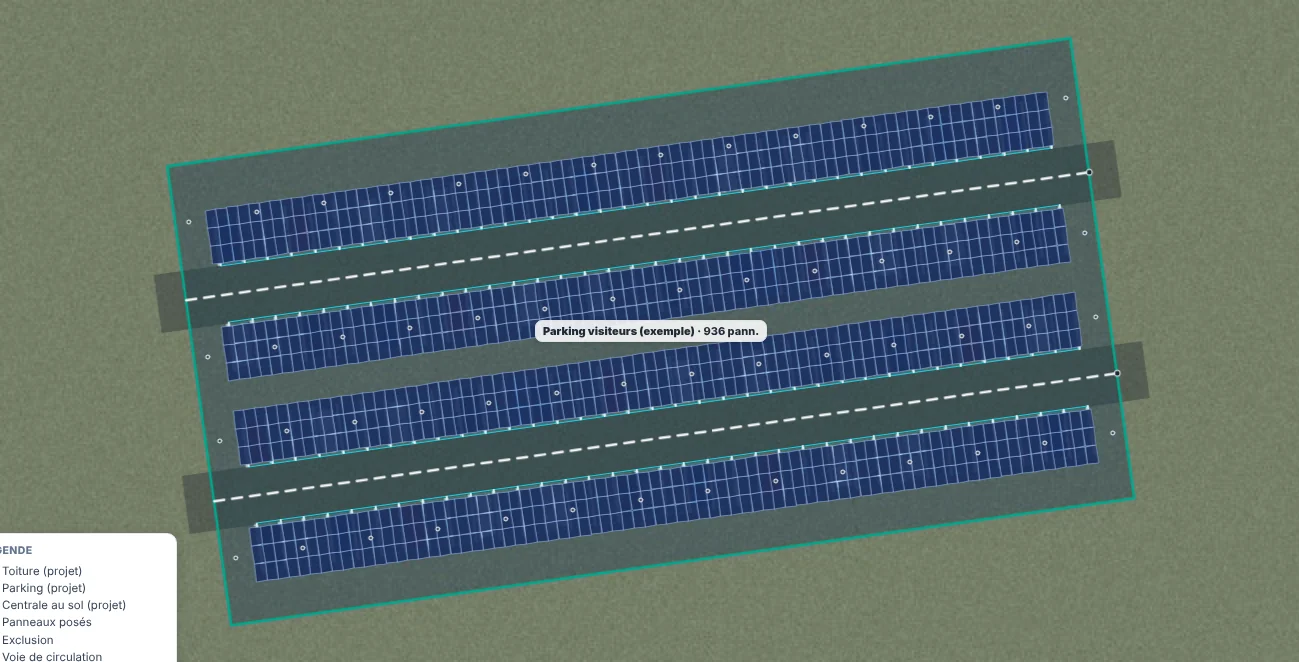
One click on a building or a car park picks up its outline; freehand drawing covers the rest. Exclusion zones, setbacks and roof planes are adjusted on the map. On a car park, the carports align with the driving lanes.
The project in 3D
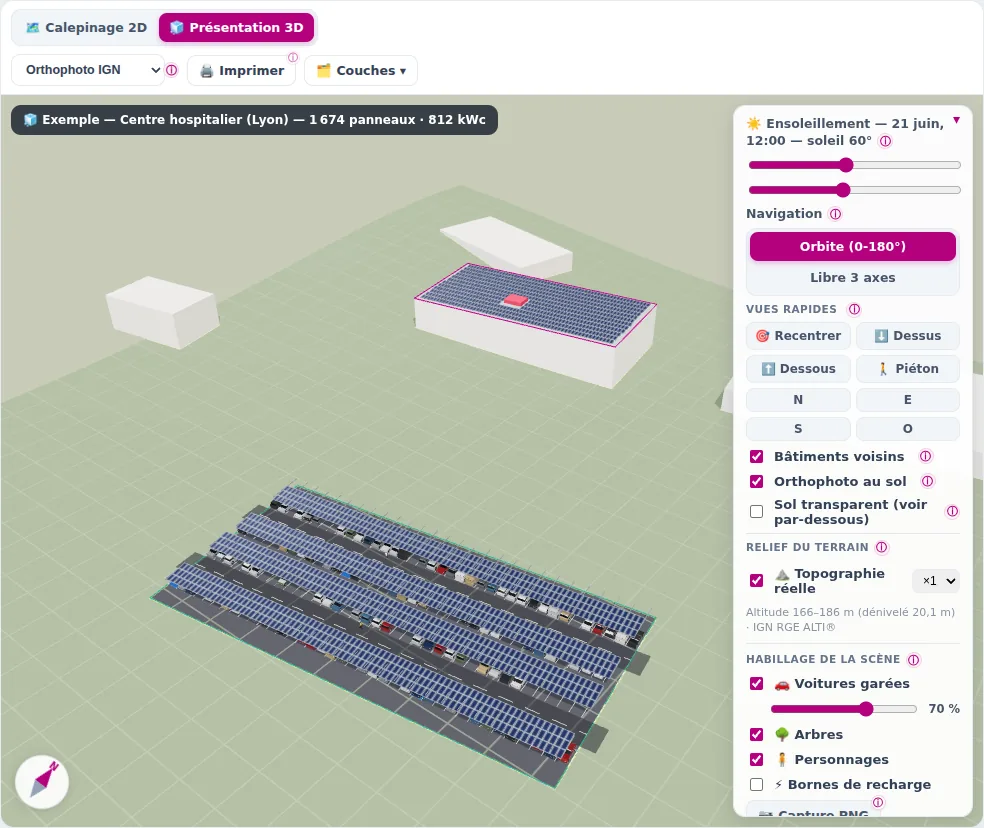
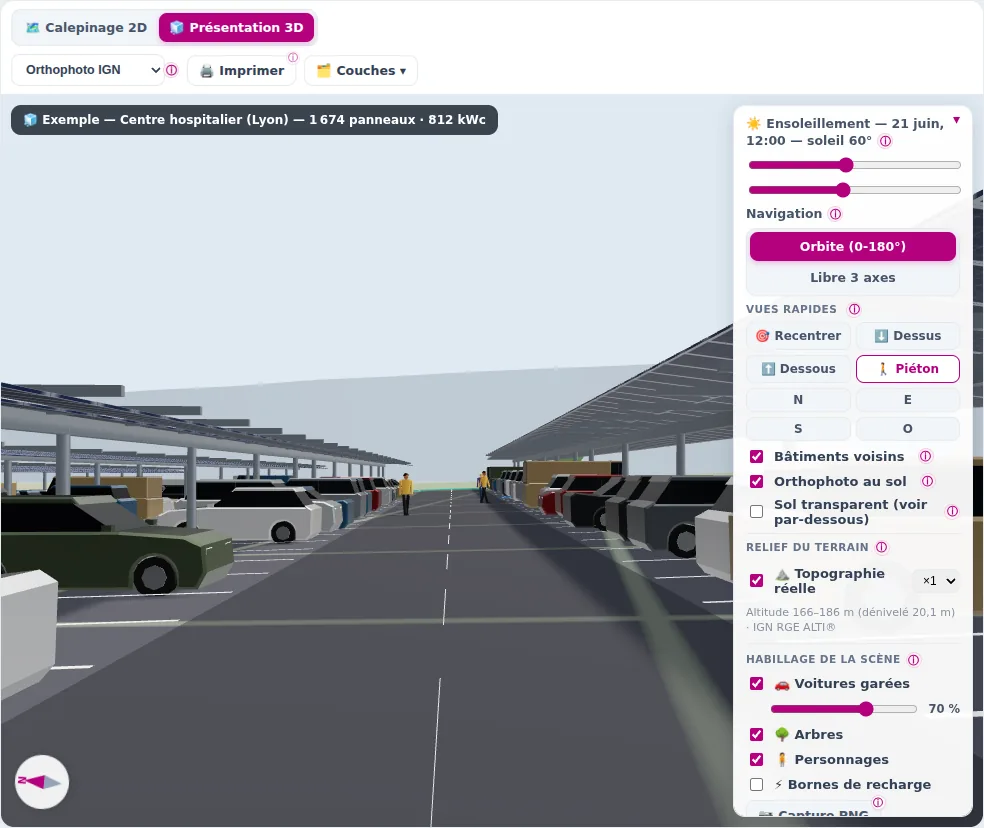
The scene shows the panel layout, neighbouring buildings and terrain relief. Set the date and time to follow the sun, switch to a pedestrian view, export the model.
Sizing and economics
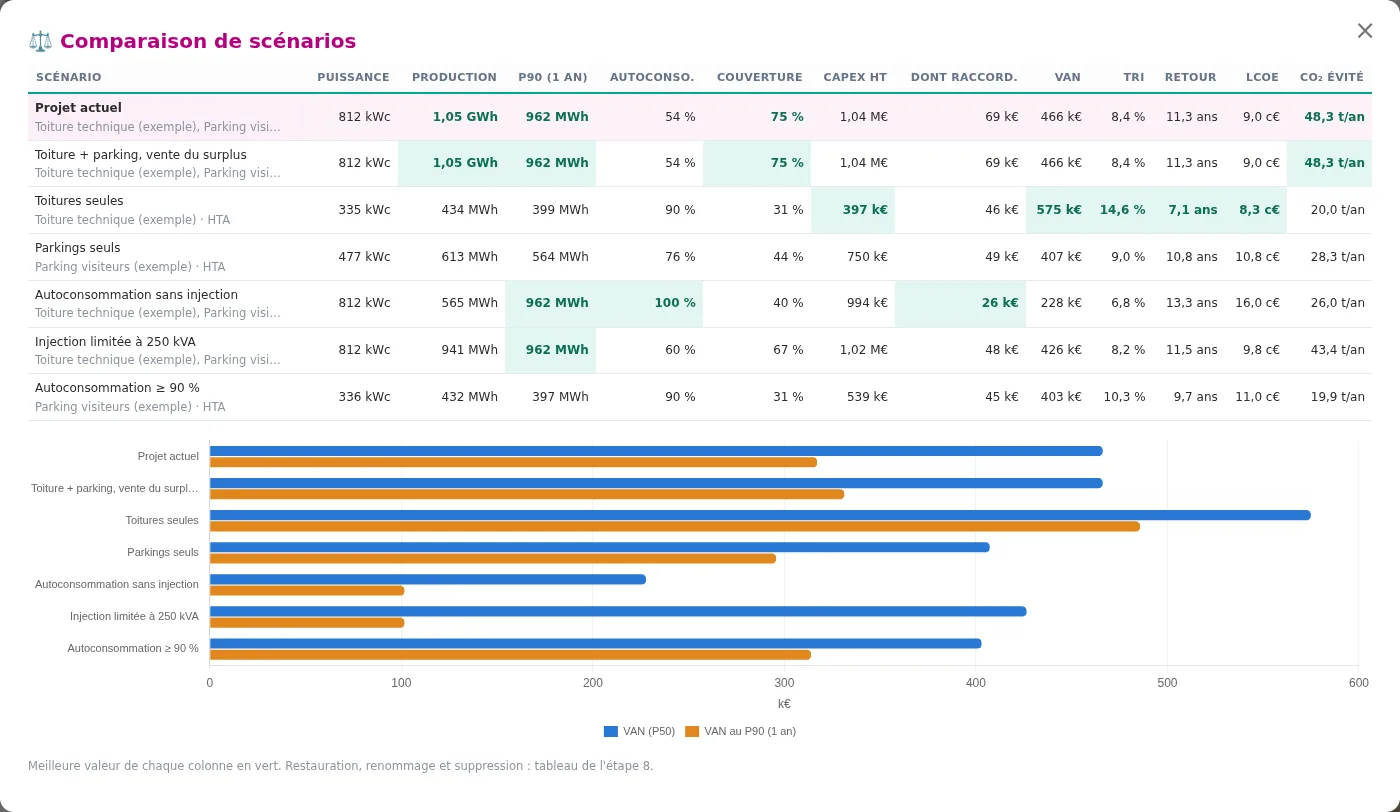
The installation is sized on the site’s consumption, up to collective self-consumption. CALIÉS calculates self-consumption, investment, NPV, IRR, payback time and carbon footprint, and compares scenarios.
What could block the project
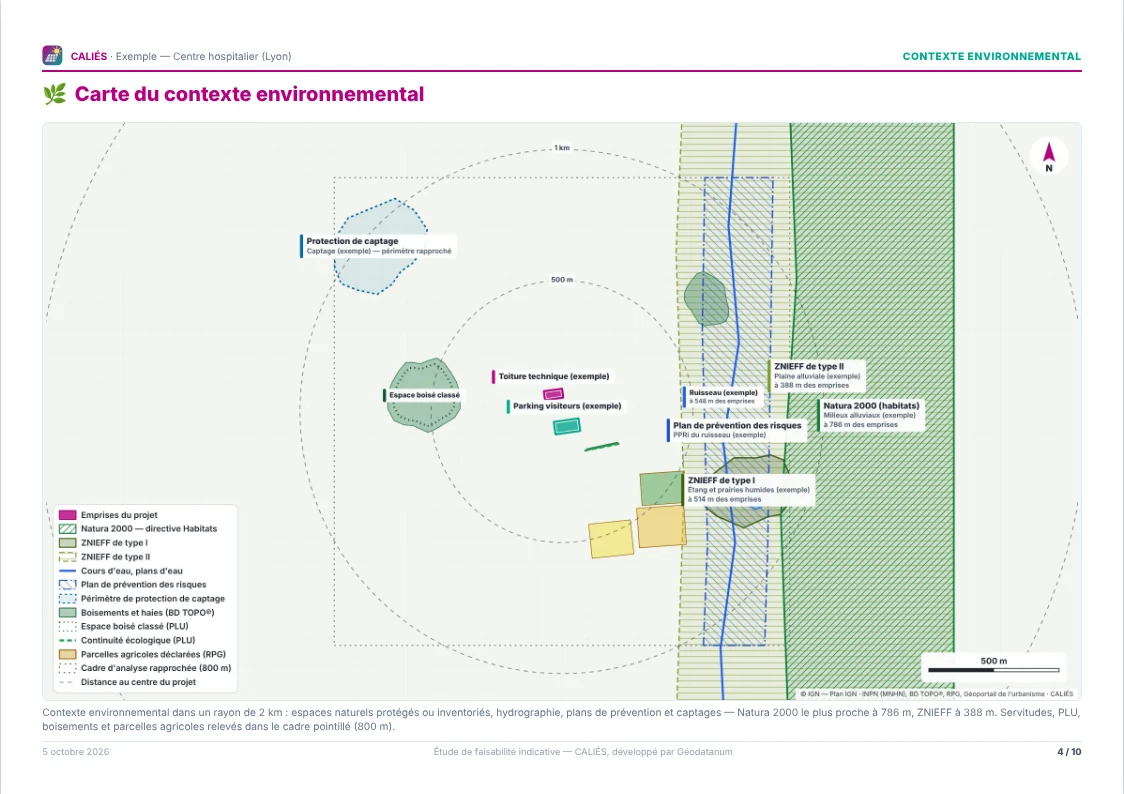
Regulatory constraints, environmental and heritage context, nearby shading, relief, grid connection: the project is placed in its surroundings.
Preliminary design and execution
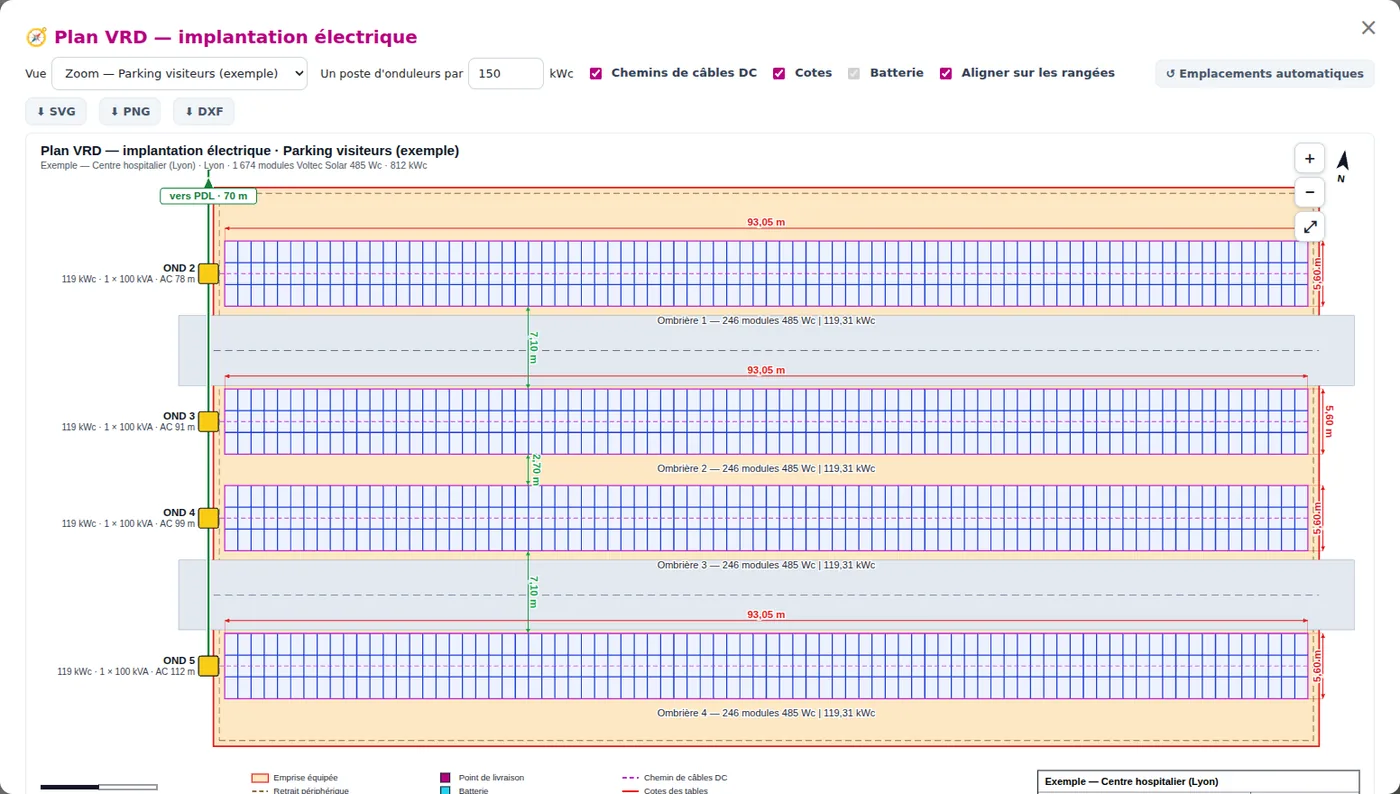
Carport structure, inverters, module strings, storage. Dimensioned site and utilities plan, cable schedule, single-line diagram and costed bill of quantities, with DXF and IFC exports.
Report and monitoring
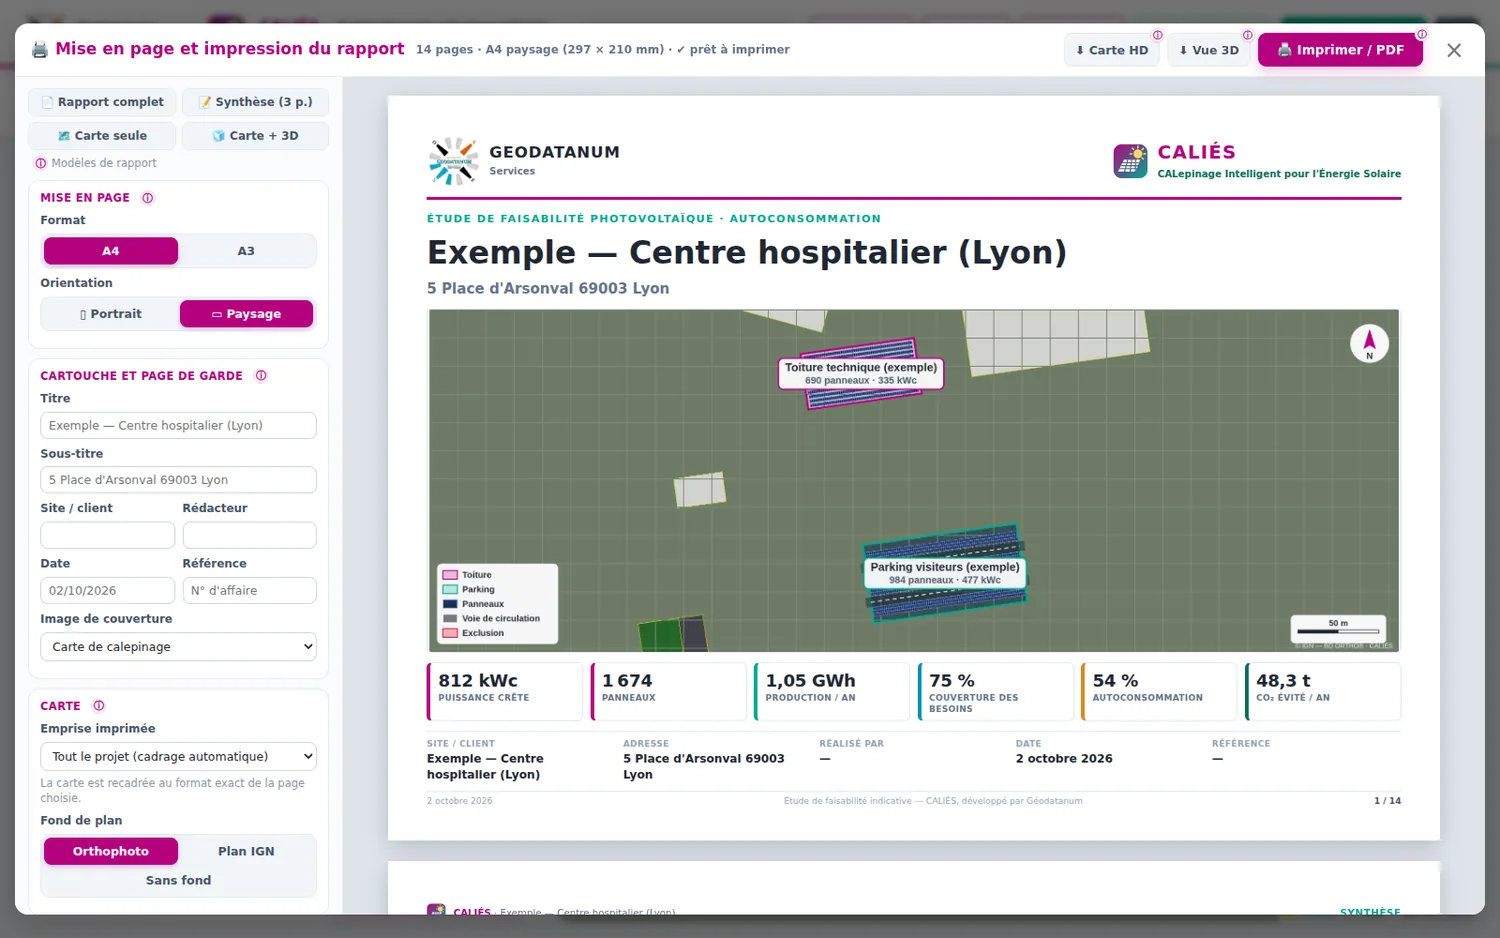
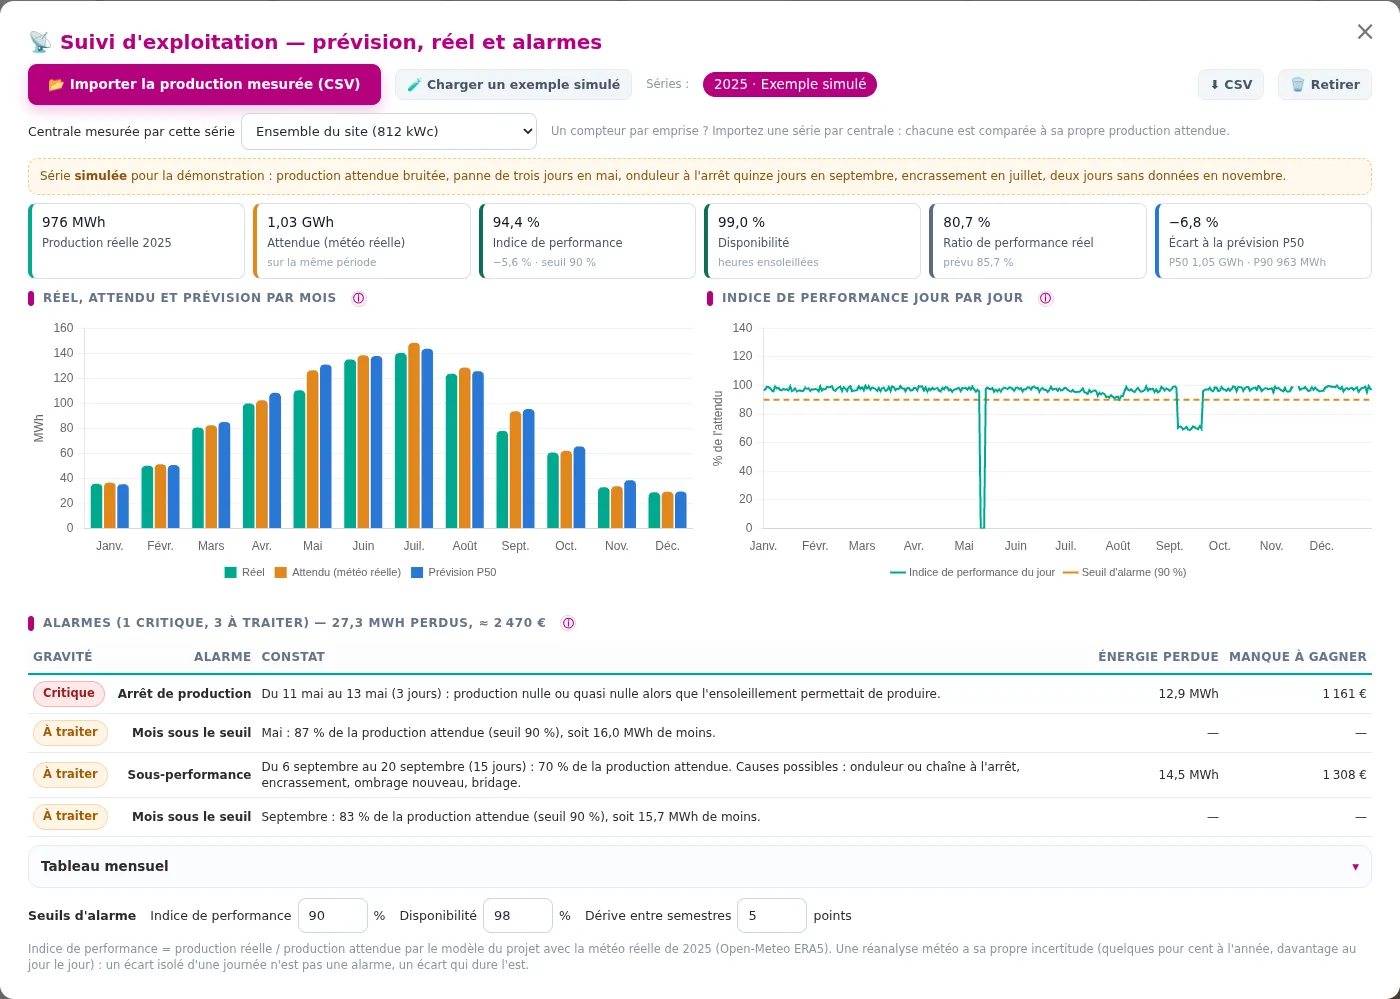
An annotated report laid out in A4 or A3, ready to print as a PDF. Once the plant is in service, measured production is compared with expected production.
Estimates of yield, costs and tariffs are indicative and must be confirmed by a detailed study.
See CALIÉS on one of your sites
Give us an address and a rough consumption figure: we will show you the application on a case that matters to you.